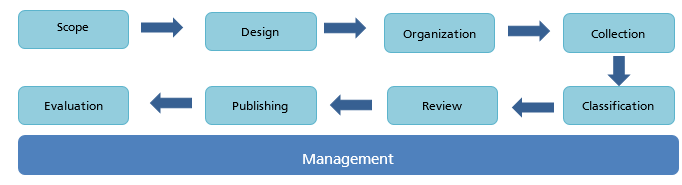

Introduction
1. First: Scope
2. Second: Design
3. Third: Organization
4. Fourth: Data collection
5. Fifth: Data disaggrregation
6. Sixsth: Revision
7. Seventh: Publication
8. Eighth: Evaluation
9. Ninth: Management
Introduction:
In all its statistical work, GASTAT applies a unified methodology suitable for the nature of each statistical product using the Statistical Procedures Guide approved by international organizations. Statistical products undergo 8 main phases, in addition to a ninth comprehensive phase, “Management”, as shown in the following diagram and
explanation underneath :
The first 3 stages (Scope, Design and Organization) are a cooperative process between GASTAT and its clients, represented by developmental entities data users, while Phase 4 (Data Collection) is done through GASTAT’s cooperation with the statistical population, whether families, businesses or holdings, in order to complete data and
information. The remaining phases are statistical stages in which data is classified, reviewed and published. Then, Phase 8 (Evaluation) is carried out with clients. The Management Phase is an administrative and organizational procedure applied across all phases. These phases have been applied to economic indicators survey as follows:
First Stage: Scope:
The starting point of the preparation of the (Economic Indicators Survey) and the first shared phase between GASTAT and other stakeholders from relevant entities, represented in (Ministry of Economy and Planning , General Organization for Social Insurance, Ministry of Commerce and Investment, and Ministry of Labor and Social Development). At this stage, a number of meetings and workshops were held between GASTAT and those entities to understand their needs and requirments.Their feedback were also considered to ensure the realization of all the objectives of the survey, which are:
1. Providing data to extract the main indicators of the national economic structure and the contribution of the private sector to the GDP.
2. Providing data on all economic activities to prepare indicators in order to identify the growth rates of each economic activity.
3. Updating the series of economic data of each economic activity.
4. Understanding the capacity of each economic activity in terms of the size of employees.
5. Identifying the change in compensations paid to employees, as well as other expenses according to the various economic activities.
6. Knowing the amount of revenues of each economic activity.
7. Providing the requirements of government entities and departments and researchers in terms of statistical data and information on economic activities.
8. Meeting the requirements necessary for compiling national accounts in line with the latest international systems.
9. Measuring the participation of each economic activity in the economic development process.
10. Using those data for the purposes of local, regional and international comparisons and for conducting studies and analyses.
11. Providing the most important seasonal economic variables that occur in economic activities.
Second Stage: Design:
During this stage, a complete design for the statistical product in addition to the tools and methods of data collection, statistical community, survey questionnaire, and sampling units are all set forth. Beneficiaries are engaged in all these processes to take their feedback into account, so that the product would live up to their expectations.
The most important outcomes of this stage are:
1. Statistical population:
The target statistical population in Economic Indicators Survey consists of all economic establishments included in (4ISIC)in Saudi Arabia.
2. Statistics Sources:
Data of the survey is based on the economic indicators survey which is a field survey conducted by GaStat on a quarterly basis and is listed under the classification of (economic statistics). Data is collected in the survey through visiting a sample of economic establishments in all administrative regions of Saudi Arabia, as well as completing an electronic questionnaire that includes a number of questions. Estimations and indicators are provided within the survey in relation to Economic Indicators Survey.
3. Terminologies and concepts:
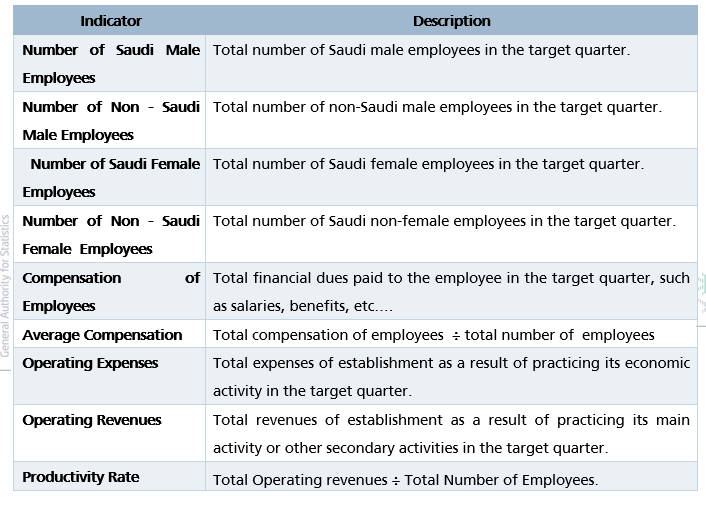
3.1. Employees:
All (Saudi and non-Saudi) individuals who already do paid or unpaid work for the establishment as well as the owners of the establishment or their relatives or workers, whether they are full-timers or part-timers, permanent or temporary workers or male or female workers, regardless of the fact that their wages are paid on a daily, weekly or monthly basis. The definition also includes partners and members of joint stock companies, in addition to heads and members of the boards of directors. It also includes employees who are entitled to paid leave.
3.2. Compensation of Employees:
Total remuneration, in cash or in kind, payable by an employer to an employee in return for work done by the latter during an accounting period. Compensation of employees consists of wages, salaries, in- kind benefits and social contributions in cash or in kind, before deducting any deductions, including share of social insurance, taxes, etc....
3.3. Operating Expenses:
The value of all commodities or services already used by the establishment during the fiscal year as a result of conducting their business, whether those requirements were bought in the same year or supplied from stock bought in past years.
3.4. Operating Revenues:
Cash revenues earned by an establishment as a result of practicing its main activity or other secondary activities, such as the sale and marketing of its products, providing services for consumers, or trading in goods in general. The operating revenues also include daily returns received for operations, total sales value of manufactured products, in addition to other operating revenues that are not related to the main economic activity of the establisment, but related to the secondary activities. Other revenues are industrial services, secondary activities, sale of production waste, rental of non-agricultural buildings and land, machinery, equipment, and any other operating revenues with their types.
3.5 .Indicators:
The economic indicators were calculated according to the following equations:
4. Used statistical classification:
Classification is defined as being an arranged set of related categories used for data collection according to similarity. It is the basis for collecting and publishing data in all statistical fields, such as economic activity, products, expenditures, jobs or health, etc. It allows for classifying data and information through putting them into meaningful categories to produce useful statistics, considering that data collection requires precise and methodological arrangement in accordance with their common features so that the statistics can be reliable and comparable. The Economic Indicators Survey is subject to international standards in data collection and classification, based on the following classification:
National Classification of Economic Activites (ISIC4)
It is a statistical classification that is based on the unified international industrial classification of all economic and productive activities. It can be defined as (all the works and services practiced or provided by the establishments whether these services have achieved a financial return or not as in the case of charity institutions which mainly depend on donations.)
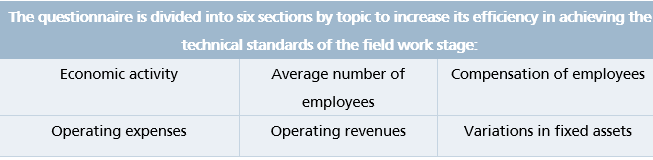
5. Design of survey’s questionnaire:
The survey’s questionnaire was drafted and designed by business statistics specialists at GaStat. International recommendations, standards, and definitions were taken into consideration during the design of the questionnaire, which was presented to experts and specialists, as well as to relevant entities to obtain their insights and comments. Questions were redrafted based on a specific scientific approach aimed at unifying question formats used by researchers.
The complete questionnaire can be viewed and downloaded through GaStat’s official website
After being approved, the survey’s questionnaire will be transformed into an electronic questionnaire that can be handled through the advanced data collection system using tablet devices. The system has the following features:
1. Reviewing the work zone of the field researcher (survey sample).
2. Reaching the sample (establishment) using the map on the tablet device.
3. Completing data of high quality using data check rules and navigation (to automatically detect input errors and illogical inputs while the completion of the data is underway).
4. Establishing communication between supervising entities by exchanging comments with field researchers.
6. Coverage:
6.1 Spatial coverage:
Economic indicators survey covers data in all 13 administrative regions of Saudi Arabia, which are: (Riyadh, Makkah, Madinah, Qassim, Eastern Region, Asir, Tabuk, Hail, Northern Borders, Jazan, Najran, Al-Baha, and Al-Jouf) . Greater importance was given to cities on the grounds that they contain around 84% of total establishments and have nearly 91% of total employees in Saudi Arabia, through visiting a sample of economic establishments in each region chosen in a scientific way, so that the sample would represent all economic establishments in the region.
6.2 Temporal coverage:
It is done during the period set out to visit the sampled establsihments and to complete the data of the survey questionnaire. The survey data is usually assigned to the quarter preceding the implementation.
7. Statistical Framework of Economic Indicators survey:
• The (2010) Establishment Census Framework was used as a list containing all population items.
• The lists, maps and analytical standards of the units were set to choose data providers (establishments).
• The required descriptive data were identified in order to create the statistical framework, create the test framework, verify them, and use them for the current survey round.
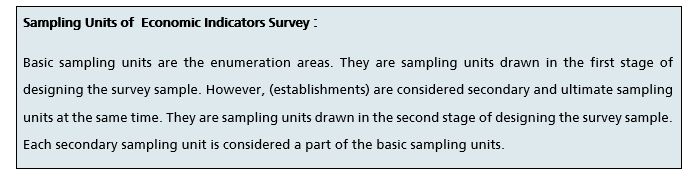
8. Sample Design:
1. Perfect plan is designed and documented to choose the sample units from which data will be collected with providing guarantee for obtaining efficient and highly effective estimations. Therefore, the survey community was divided into non-overlapping parts characterized by the homogeneity of their units. Every part is considered a layer, and every layer is treated as being an independent community where a random sample would be drawn separately from every layer. At the end, all drawn sampling units will be integrated to form an aggregate sample.
2. Selecting the sample units is done on the basis of the 2010 Establishment Census. In order to choose samples for surveys and statistical studies targeting establishments in general, the framework was divided into four categories on the basis of the establishment size as follows:
• Micro-establishments, including all establishments that have a workforce of 1-5.
• Small establishments, including all establishments that have a workforce of 6-49.
• Medium establishments, including all establishments that have a workforce of 50-249.
• Large establishments, including all establishments that have a workforce of more than 250.
3. Perfect methodology is prepared to choose sample units in order to provide high-quality outputs with minimum burden on data providers using methods of rotation and overlap control.
4. Required descriptive data are specified to apply the statistical framework and to allocate and choose the sample..
5. The sample is tested, assessed and verified, and its use in the current frequency of the project is approved.
Third Stage: Organization
It is the final preparation stage that precedes establishment visit and data collection. In this stage, the required workflow procedures are established for preparing Economic Indicators Survey, starting with the “collection stage“ and ending with the “evaluation stage“ and the organization and grouping of those procedures. The optimal sequence of those procedures is chosen to arrive at a methodology that achieves the goals of the economic indicators . A review was made in this stage of the procedures that were taken upon the preparation of the previous version of the survey to develop the work procedures in the current version. Those procedures were also described and documented to facilitate any updates in future rounds. The statistical workflow procedures were tested and examined to ensure their compliance with the requirements of preparing Economic Indicators Survey, approve the procedures of the statistical workflow, and develop a roadmap for implementation.
Testing the efficiency of input systems and the process of transmitting, synchronizing and reviewing data through either the tablet or office system of the survey are the main procedures in this stage.
Fourth Stage: Data Collection
First: The sample of the survey was selected by identifying (5.000) establishments engaged in targeted economic activities as a chosen sample representing the survey community and distributed to all 13 regions of Saudi Arabia.
Second: the nominated workers were selected as field researchers who visited the establishments (Economic Indicators Survey) to collect data based on several practical and objective criteria related to the nature of the work, such as:
• Educational level.
• Fieldwork experience.
• Personal attributes, such as: good conduct and physical and psychological fitness.
• Candidate’s success in the training program of the Economic Indicators Survey.
• The candidate shall not be under the age of 20.
Third: All candidates (GaStat staff and collaborators from some government entities) were qualified and trained through special training programs as follows:
• A training program was held for expert staff members in GaStat’s headquarters for one week.
• Similar training programs were held for collaborating inspectors, observers, and researchers from all the regions of Saudi Arabia.
Fourth: The method of direct contact with the establishment was adopted in the process of completing the survey questionnaire and data collection. The field researchers visited the establishments located within the survey sample after arriving at it using the coordinates recorded on the tablets and the guiding maps and introducing themselves and showing official documents proving their statistical identity. They also clarified the aim of their visit, and presented an overview of the survey and its objectives. The electronic questionnaire was then completed orally through direct contact with the owner of the establishment (point of sale)or any official who is familiar with its affairs.
Fifth: All field researchers used tablet devices to collect the survey questionnaire data according timeframes specified for navigating the survey sections and the questionnaire items.
Sixth: Field researchers at all work locations in Saudi Arbia used the “synchronization” feature available on the tablet devices to download and transfer the completed data of the establishments directly to the database linked to them at GaStat’s headquarters where they are stored in a specific way to be reviewed and processed at a later stage.
Seventh: Electronic (check rules) were applied to guarantee the accuracy, consistency, and rationality of the data entered in the economic indicators survey questionnaire. They are electronic rules that identify contradictions and they were designed by using a logical link between the answers of the questionnaire and its variables to help field researchers directly identify any errors upon completing the survey data with the official in charge of data provision. Those programmed rules don’t allow any mistakes to go through when an answer contradicts with another piece of information or another answer in the questionnaire.
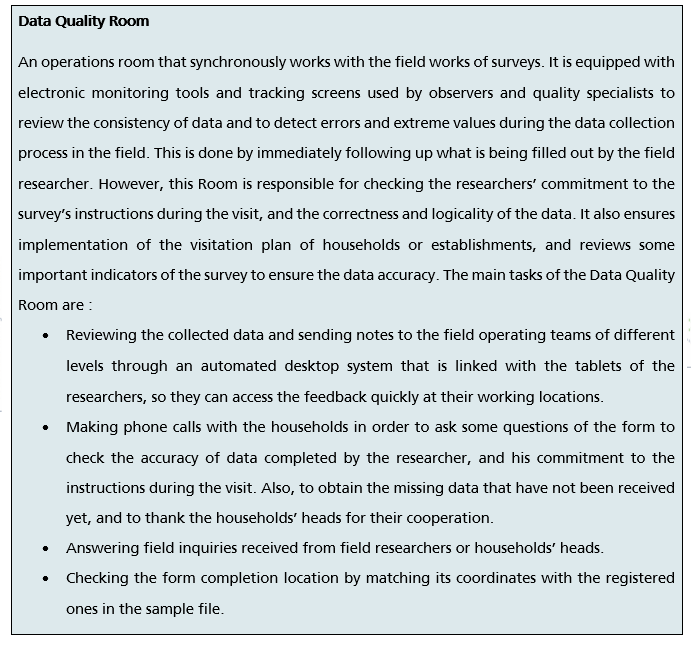
Eighth: The collected data were verified through being reviewed by the field researcher, their inspector and the survey supervisor in the supervision area. All work areas were subjected to a monitoring and reviewing process from the Data Quality Room at GaStat’s headquarters. The Room also controls and monitors the performance of all working groups in the field during the data collection process, starting from the first day and until the last.
Fifth stage: Disaggregation
During this stage, raw data of the Economic Indicators Survey are disaggregated based on the classification and coding inputs completed during the data collection process. They were disaggregated based on (ISIC4) or any other classification and coding, such as: data distribution at the level of administrative regions, qualitative and descriptive classification in terms of gender determination, individual’s marital status, or quantitative classification such as income groups.
During this stage, specialists of Business Statistics Department conducted data processing and analysis based on several procedures, as follows:
• Sort and arrange data in sequence format or in different groups or categories.
• Summarize detailed data into key points or data.
• Combine many data segments and make them interconnected.
• Process missing data.
• Process unreasonable data.
• Convert data into statistically significant data.
• Organize, present, and interpret data.
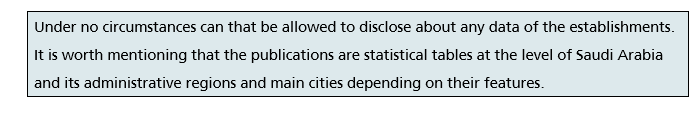
Data of economic indicator survey are presented in right tables in order to summarize, understand, as well as extract their results. Moreover, to compare them with other data, and to obtain statistical significances about the selected community. However, referring to such data indicated in tables is much easier than going back to check the original questionnaire that may include some data like names and addresses of establishments and data providers, which might violate the confidentiality of the statistical data. One of the most important procedures of data processing is “data anonymization”. To keep data confidential, GASTAT removed all identifiers from the entered dataset either data of field survey. The name, address, and other identifiers of the establishment owner will be hidden for individual’s privacy.
Sixth stage: Reviewing:
First: Verifying data outputs:
After reviewing and verifying the accumulated data of the survey, GaStat conducted at this stage processes of calculating and extracting results and uploaded and stored them on the database. The final reviewing processes were conducted by specialists in business statistics using modern technologies and software designed for the purposes of reviewing and checking.
Second: Handling of confidential data:
Pursuant to Royal Decree No.23 dated 07/12/1397, GaStat is committed to the absolute confidentiality of all completed data and not using them except for statistical purposes. Therefore, data are safely stored on GaStat’s servers.
Seventh stage: Publication
First: Preparation and Process of the Results Designed for Publishing:
During this stage, GASTAT downloaded the data results from the database of Economic Indicators Surveys. Then, publishing tables and charts of data and indicators, metadata, and methodology were all prepared and processed to be published in both languages English and Arabic.
Second: Preparing Media Kit and Announcing the Date of the Release:
The publication date of the bulletin is already set up by GASTAT on its official website at the beginning of the Calendar Year. During this period, the Authority is preparing the media kits to announce the date of releasing the bulletin through media, in addition to its various platforms in social networking sites. The bulletin will be published firstly on GASTAT’s official website in different formats, such as Excel format to be easily reached for all clients and those who are interested ICT access and usage in general. It will be uploaded on the website’s statistics library as well.
Third: Communicate with the clients and provide the bulletin to them:
GASTAT believed in the importance of communication with the clients, therefore, once the bulletin is released, GASTAT will communicate with the clients and provide them with the bulletin. GASTAT will receive the questions and enquiries about the bulletin and its results through its various channels. Requests and enquiries are received through:
- GASTAT official website www.stats.gov.sa
- GASTAT official e-mail info@stats.gov.sa
- Client support’s email cs@stats.gov.sa
- Visiting GASTAT head office in Riyadh or in one of its branches in Saudi Arabia.
- Official letters.
- Statistical help line (920020081)
Fourth: Preservation of published content:
The Bulletin’s data are preserved and archived by the documents and archives center at the Authority to be used as a reference at any time. GASTAT carried out this step to preserve such data electronically to be used again when needed.
Eighth stage: Evaluation
All GASTAT’s clients who used the results of the Bulletin will be contacted again in order to assess the entire statistical process. This is done for improvement purposes in order to obtain high-quality data. The improvements include: methodologies, procedures and systems, statisticians’ skill level, as well as statistical work frameworks. This stage is carried out with data users and GASTAT clients according to the following steps:
First: Collecting measurable assessment inputs:
The most important comments and notes are collected and documented from their sources in different stages, for example comments and notes given by data collectors and their field supervisors. Also, notes written by specialists responsible for reviewing, auditing, and analyzing data collected from the field team or administrative regions. Finally, comments and notes collected and documented by data users after publishing the Bulletin, or social media comments and clients’ feedback that sent to the Authority through its main channels.
Second: the Evaluation procedure:
It is done by analyzing the collected assessment inputs, and comparing the results of this analysis with the ones predicted previously. Therefore, a number of possible improvements and solutions are identified and discussed with specialists, experts, and concerned partners. During this step, clients' performances and satisfaction levels of using the results of Economic Indicators Survey are measured. Based on these procedures, the recommendations for obtaining high quality data for the next statistics are all agreed upon.
Ninth stage: Management
It is a comprehensive stage that is required to carry out each stage of Economic Indicators Survey production. During this stage, the plan was set, which includes the feasibility study, risk management, financing methods, in addition to expenditure mechanisms. The plan also covered the development of performance indicators, quality criteria, and manpower map required for production. Through this plan, the implementation process of the tasks assigned to different departments at each stage will be followed up and reported to ensure that GASTAT meets its clients’ requirements .
عنوان الملف:
Short Term Business Statistics